💚 Donate
October 27, 2026 · 03:57 PM JST
⚠ Snapshot data · Not real-time · Refreshes every 30 min

RWA Intelligence Platform

Real-world asset relative value for retail investors. Which assets are historically cheap or expensive right now?

$79,494 Bitcoin
14 Active Signals
28 Pairs Tracked
34 Stocks Tracked
🌐

RWA Landscape

Source: Keyrock + Securitize · Apr 2026 ↗ · rwa.xyz · IMF
Distribution readiness · Keyrock/Securitize · 36-point scale
* = estimated
27
Treasuries
~22*
Equities
~20*
Commodities
14
Private Credit
~12*
Alt Funds
Confirmed: Treasuries 27, Private Credit 14. Others estimated from public Keyrock/Securitize commentary. Full report ↗
$27B tokenized out of $400T total global assets.
$400T
global assets
Untokenized — $399.97T
Tokenized — $27B · <0.1%
Scale check
If global assets were the Pacific Ocean, tokenized RWA is a bathtub. A $100-bill stack to $1T reaches 1,100km. The orange sliver on this chart is not visible at true scale.
Distributed — $27B
Truly on-chain
Composable. Wallet-to-wallet. Usable as DeFi collateral. T+0 settlement. Public blockchain visibility.
BUIDL · OUSG · BENJI · PAXG
Represented — $394B
Blockchain-assisted
Permissioned ledgers. Back-office coordination only. Asset stays in legacy system. Not composable.
Broadridge $372B repo · DTCC
The trust gap
The pitch writes itself. Regulated structure, real underlying assets, predictable yield, T+0 settlement. The problem is not the product — it is that institutional memory is long. Every generation gets a new wrapper around the same promise. RWA might actually be different this time. But “this time is different” is the most expensive phrase in finance, and the people with the chequebooks know it.
Keyrock + Securitize project 2027 as the convergence window — regulation, liquidity, and distribution maturing simultaneously.
#1
Strategy
MSTRNASDAQ
Pure Play
848,517₿
$67.45B BTC held  ·  vs $59.22B mkt cap
Stock-implied BTC
$69,797
↓ 12.2% vs spot
Stock Price
$139.82
Mkt Cap $59.22B
#2
Metaplanet Inc.
3350.TTSE
Diversified
44,000₿
$3.50B BTC held  ·  vs $2.23B mkt cap
Stock-implied BTC
$50,696
↓ 36.2% vs spot
Stock Price
¥258
Mkt Cap $2.23B
#3
Twenty One Capital
XXINASDAQ
Pure Play
43,514₿
$3.46B BTC held  ·  vs $1.94B mkt cap
Stock-implied BTC
$44,610
↓ 43.9% vs spot
Stock Price
$5.60
Mkt Cap $1.94B
BTC Perpetual Positioning
snapshot 40m ago
Open Interest
$15.48B
193,877 BTC
24h delta: building
Funding Rate (8h)
+0.0080%
OI-weighted
equal: +0.0080%
Funding APR
+8.80%
annualized
equal: +8.77%
Venues
3 of 3
Binance, Bybit, Okx
⚙ Coverage filter active — showing 34 companies with ≥1,000 BTC and $50M–$500B market cap (of 140+ tracked universe).

Trading Below BTC NAV

17 companies · mNAV < 1.0
CompanyStock PriceBTC Holdings BTC Value (NAV)Market Cap mNAV ⓘvs BTC NAVBTC NAV Rating
Alpha Modus HoldingsAMOD.USDiversified$1.06DEEP BTC DISCOUNT ⚠️0.24x-76.2%3,170 ₿$252.0M$60.0M
American Bitcoin CorpABTC.USPure Play$7.26SLIGHT BTC DISCOUNT0.89x-11.3%7,500 ₿$596.2M$528.7M
Bitcoin Group SEADE.DEPure Play€25.02DEEP BTC DISCOUNT ⚠️0.49x-51.3%3,605 ₿$286.6M$139.7M
Boyaa Interactive International Limited0434.HKDiversifiedHK$2.64MODERATE BTC DISCOUNT0.75x-25.0%4,091 ₿$325.2M$243.9M
Cango IncCANG.USDiversified$1.28LARGE BTC DISCOUNT0.64x-35.6%1,026 ₿$81.5M$52.5M
Capital BALCPB.PADiversified€5.73SLIGHT BTC DISCOUNT0.88x-12.2%3,525 ₿$280.2M$246.0M
DeFi TechnologiesDEFI.NEPure PlayC$0.55MODERATE BTC DISCOUNT0.74x-26.2%2,597 ₿$206.4M$152.3M
Gemini Space Station IncGEMI.USDiversified$2.87AT BTC NAV0.97x-3.0%4,827 ₿$383.7M$372.1M
MARA Holdings, Inc.MARA.USPure Play$6.84SLIGHT BTC DISCOUNT0.93x-6.6%35,577 ₿$2.83B$2.64B
Metaplanet Inc.MPJPY.USDiversified¥258LARGE BTC DISCOUNT0.64x-36.2%44,000 ₿$3.50B$2.23B
Nakamoto IncNAKA.USDiversified$6.74DEEP BTC DISCOUNT ⚠️0.34x-66.1%4,467 ₿$355.1M$120.5M
OranjeBTCOBTC3.SADiversifiedR$6.84LARGE BTC DISCOUNT0.66x-33.8%3,950 ₿$314.0M$207.9M
Silvia, Inc.SVIA.USDiversified$3.46LARGE BTC DISCOUNT0.70x-30.4%4,965 ₿$394.7M$274.6M
StrategyMSTR.USPure Play$139.82SLIGHT BTC DISCOUNT0.88x-12.2%848,517 ₿$67.45B$59.22B
StriveASST.USPure Play$26.32MODERATE BTC DISCOUNT0.78x-22.3%43,000 ₿$3.42B$2.66B
Twenty One CapitalXXI.USPure Play$5.60LARGE BTC DISCOUNT0.56x-43.9%43,514 ₿$3.46B$1.94B
ZOOZ PowerZOOZ.USDiversified$6.33LARGE BTC DISCOUNT0.62x-38.4%1,036 ₿$82.4M$50.7M

Trading Near BTC NAV

1 companies · mNAV 1.0–1.15x
CompanyStock PriceBTC NAV Rating mNAV ⓘvs BTC NAV BTC HoldingsBTC Value (NAV)Market Cap
Canaan Inc.CAN.USDiversified$0.21AT BTC NAV1.07x+6.9%1,826 ₿$145.2M$155.2M

Trading Above BTC NAV

16 companies · mNAV > 1.15x
CompanyStock PriceBTC NAV Rating mNAV ⓘvs BTC NAV BTC HoldingsBTC Value (NAV)Market Cap
BitFuFu Inc.FUFU.USPure Play$1.12ABOVE BTC NAV1.28x+28.3%1,830 ₿$145.5M$186.7M
BitGo Holdings, Inc.BTGO.USDiversified$5.40HIGH BTC PREMIUM2.04x+104.4%3,854 ₿$306.4M$626.2M
Block, Inc.XYZ.USDiversified$74.55VERY HIGH BTC PREMIUM62.38x+6138.1%9,032 ₿$718.0M$44.79B
BullishBLSH.USPure Play$27.60HIGH BTC PREMIUM2.21x+121.2%23,800 ₿$1.89B$4.19B
CleanSpark, Inc.CLSK.USPure Play$7.77ABOVE BTC NAV1.86x+86.4%13,470 ₿$1.07B$2.00B
Coinbase Global, Inc.COIN.USDiversified$159.60VERY HIGH BTC PREMIUM30.60x+2959.9%17,311 ₿$1.38B$42.11B
Galaxy Digital Holdings LtdGLXY.USPure Play$15.68ABOVE BTC NAV1.82x+81.8%21,084 ₿$1.68B$3.05B
Hut 8 Mining CorpHUT.USPure Play$62.97VERY HIGH BTC PREMIUM7.13x+612.9%13,696 ₿$1.09B$7.76B
Ionic Digital Inc.IOND.USDiversified$65.23VERY HIGH BTC PREMIUM12.81x+1181.1%2,882 ₿$229.1M$2.94B
Keel Infrastructure CorpKEEL.USDiversified$2.18VERY HIGH BTC PREMIUM10.87x+987.0%1,558 ₿$123.9M$1.35B
NEXON Co., Ltd.3659.TDiversified¥2,776VERY HIGH BTC PREMIUM100.39x+9939.3%1,717 ₿$136.5M$13.70B
Remixpoint3825.TPure Play¥229ABOVE BTC NAV1.78x+78.3%1,501 ₿$119.3M$212.8M
Riot Platforms, Inc.RIOT.USPure Play$12.59HIGH BTC PREMIUM3.79x+279.0%15,680 ₿$1.25B$4.72B
The Smarter Web Company PLCSWC.LDiversifiedGBp 47.24VERY HIGH BTC PREMIUM81.83x+8083.4%2,747 ₿$218.4M$17.87B
Trump Media & Technology Group Corp.DJT.USDiversified$6.14HIGH BTC PREMIUM2.25x+125.0%9,542 ₿$758.5M$1.71B
USBC, Inc.USBC.USPure Play$0.42HIGH BTC PREMIUM2.05x+105.1%1,000 ₿$79.5M$163.0M
mNAV = market cap divided by BTC holdings value. Below 1.0x means the market values the company at less than its BTC. Z-score compares current mNAV to 3-year history. Deep discounts may reflect operational risk, not just BTC value. · Data: bitcointreasuries.net · BTC price: CoinGecko live · Updates every 30 min · Educational only — not financial advice.
⊘ Restricted Access

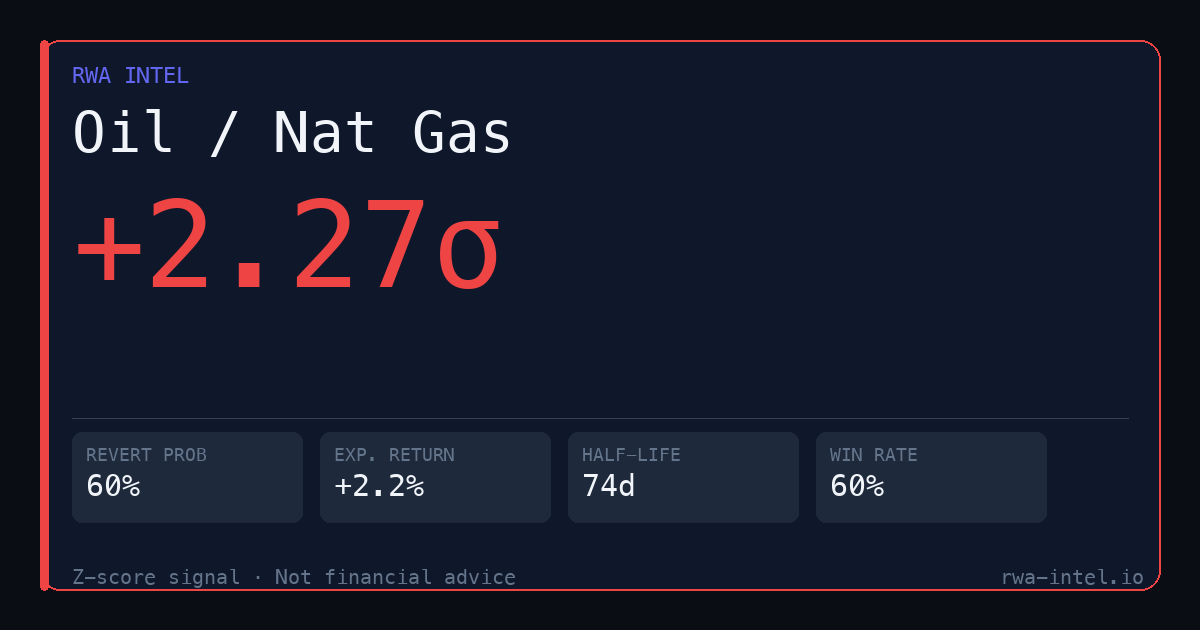
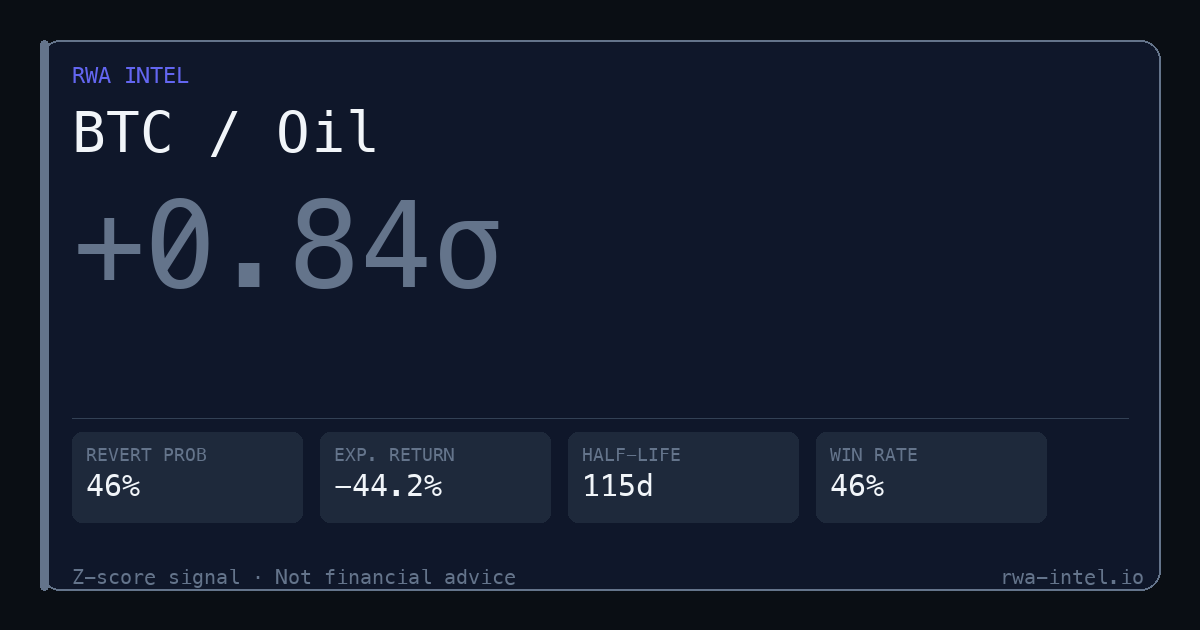
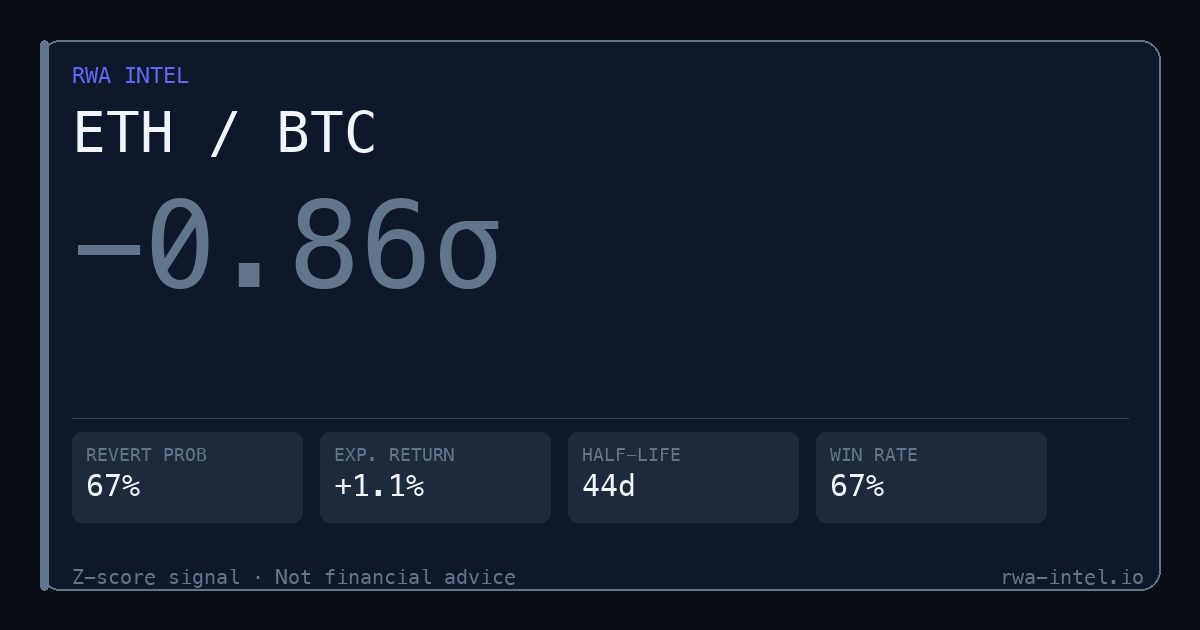
RWA Ratio Matrix

Full cross-asset signal matrix is in restricted access during ongoing commercial discussions.

Institutional access is available to qualified parties under appropriate commercial terms.

Inquiries
scott@rwa-intel.io
Incorrect access code
⊘ Restricted Access

Live Signal Data

Real-time cross-asset relative-value signals are in restricted access during ongoing commercial discussions.

Institutional access is available to qualified parties under appropriate commercial terms.

Inquiries
scott@rwa-intel.io
Incorrect access code
🏦 Tokenized
Treasuries
On-chain T-Bills
See more ↓
Best Rate
5.10%
USTB · Superstate
vs 3M T-Bill
+1.07%
benchmark: 4.03%
Total TVL
$7.6B
across 8 products
Verdict
✅ Worth it
vs direct T-Bills
💰 DeFi Yields
Stablecoin pools
Live APY vs T-Bills
See more ↓
10yr T-Bill Rate
4.99%
Risk-free benchmark (^TNX)
Best Safe DeFi APY
7.52%
Blue-chip, low risk
DeFi Premium
+2.54%
Extra yield vs T-Bills
Verdict
✅ DeFi worth the risk
vs blue-chip safe yield

Short-End Treasury Intelligence

0-3Y yield curve · Tokenized vs traditional · Break-even risk · Updated every run
⚠
Short-End Curve Flat/Inverted
3M (4.03%) exceeds 1-3Y (3.80%) by 0.23%. No yield pickup for extending duration. 3-month tokenized products maximise yield with minimum duration risk.
Short-End Yield Curve — Live
3M
4.03%
^IRX direct
0-3M
3.69%
SGOV ETF
1Y
3.69%
SHV ETF
1-3Y
3.80%
VGSH ETF
5Y
4.82%
^FVX
10Y
4.99%
^TNX
^IRX · SGOV, SHV, VGSH ETF yields · ^FVX ^TNX for context
Tokenized vs Traditional  ·  3M T-bill: 4.03%
USTBLIVE
Superstate  ·  $0M
APY
5.10%
vs T-bill
+1.07%
BUIDLLIVE
BlackRock  ·  $2.40B
APY
5.00%
vs T-bill
+0.97%
USYCLIVE
Hashnote/Circle  ·  $2.70B
APY
5.00%
vs T-bill
+0.97%
USDMLIVE
Mountain Protocol  ·  $3M
APY
4.90%
vs T-bill
+0.88%
WTGXXLIVE
WisdomTree  ·  $855M
APY
4.70%
vs T-bill
+0.67%
BENJILIVE
Franklin Templeton  ·  $1.00B
APY
4.50%
vs T-bill
+0.47%
OUSGLIVE
Ondo Finance  ·  $684M
APY
3.83%
vs T-bill
-0.20%
STBTLIVE
MatrixDock  ·  $0M
APY
3.68%
vs T-bill
-0.35%
Green = strong premium (>1%) · Amber = thin premium · Red = below T-bill. Educational only. Not financial advice.
Global Reserve Stablecoins
Many major stablecoins are backed by foreign government treasuries. Compare yields and backing quality to US T-Bills for reserve diversification insight. Backing claims from issuers — verify independently.
StablecoinIssuerCurrencyPrimary BackingImplied YieldTVL (approx)Regulator / Notes
XSGDStraitsXSGDSGD cash & Singapore Govt Securities (SGS)~3.5% (MAS rate)~$60MMAS-regulated. Ethereum & Polygon.
EURCCircleEUREuro cash & short-term EU gov securities~2.5% (ECB rate)~$200MMiCA-compliant. ACPR (France).
EURSStasisEUREUR bank deposits & European sovereign bondsYield not published~$130MMalta-based. Oldest EUR stablecoin.
GYENGMO TrustJPYJPY cash & Japanese Govt Bonds (JGBs)~0.5% (BOJ rate)~$15MNYDFS-regulated. GMO Internet Group.
XCHFCrypto Finance AGCHFCHF cash & Swiss government bonds~1.0% (SNB rate)~$25MFINMA-regulated. Deutsche Borse subsidiary.
GBPTTetherGBPGBP cash & UK Gilts~4.75% (BOE rate)~$20MFCA sandbox. Low liquidity vs USD stablecoins.
CNHTTetherCNHOffshore CNH cash (not PRC gov bonds)Yield not published~$40MOffshore CNH only. Regulatory risk.
⚠ TVL and yield figures are approximate and updated periodically. Backing claims sourced from issuer disclosures — verify independently before use.
🇺🇸 US 10Y
—
Benchmark
🇯🇵 JGB 10Y
—
vs US —
🇩🇪 Bund 10Y
—
vs US —
🇬🇧 Gilt 10Y
—
vs US —
🇦🇺 ACGB 10Y
—
vs US —
🌐

Global Sovereign Yields

⏳ Loading...
Global Sovereign Yields — Live 2Y / 10Y / 30Y yields for US, Japan, Germany, UK, and Australia fetched on page load. Spreads vs US Treasuries reveal capital flow risk and RWA relative value. Rising JGB yields and Bund moves are key macro signals for tokenized asset allocators. · Data via Yahoo Finance · Educational only · Not financial advice.
See Also
Tokenized Treasuries Signals Real Assets
Why It Matters
JGB yield rises pressure yen carry trades and redirect capital toward US assets. Bund moves signal Eurozone stress. Spread widening vs US Treasuries is a leading indicator for RWA tokenized flow.
⏳ Fetching live sovereign yield data...
Multi-Country Yield Comparison — Live
Country 2Y 10Y 30Y Curve (2-10) Status
Loading yield data...
Spread Monitor — vs US 10Y
How each country's 10Y yield compares to the US benchmark. Negative = yields below US (capital flow risk). Positive = yields above US (attractive alternative).
Loading spread data...
Yield Curve Shape — 2Y→10Y Steepness
Loading curve data...
Data sources: Yahoo Finance via corsproxy.io · Tickers: ^TNX ^TYX ^IRX (US) · ^JGB (Japan approx.) · German Bund, UK Gilt, AU Bond ETF proxies · Yields refresh on page load. Some tickers may be delayed 15-20 min. Educational only. Not financial advice.
Sovereign yield comparisons reflect local monetary policy, inflation expectations, and currency risk. Higher yields in emerging markets often reflect higher default or devaluation risk — not better returns. ⚠️ FX movements can wipe out yield advantages.  ·  Data: Yahoo Finance via corsproxy.io  ·  Educational only — not financial advice. Always do your own research.
💱 Non-USD FX
On-Chain Forex
EURC · GYEN · XSGD · BRZ
See more ↓
Total FX TVL
⏳
live · DeFiLlama
Best FX Pool APY
⏳
top LP yield
vs $7.5T TradFi FX
⏳
BIS 2022 daily vol
Verdict
⏳
💵 USD Stables
Dollar Stablecoins
USDT · USDC · frxUSD · DAI
See more ↓
USDT Market Cap
$143B
dominant issuer
USDC Market Cap
$60B
regulated issuer
Best Stable APY
⏳
top USD pool
Clarity Act Status
⚠️ Senate markup
$6.6T deposit risk
🆕 New Listing
KRWQ
Korean Won
EDX Markets has listed KRWQ — the first non-USD stablecoin on both spot and perpetual futures in an institutional-grade stack. A regulated on-chain alternative to the $100B+ daily KRW offshore NDF market. KRWQ is tracked in the Non-USD FX sub-tab below.
NDF MARKET
$100B+
daily volume
VENUE
EDX Markets
spot + perps
On-chain FX lets you swap non-USD currencies 24/7 without a bank. These pools price EURC, GYEN, XSGD, BRZ, KRWQ and others directly on-chain. The spread between the traditional spot rate and the on-chain pool rate shows the current cost premium of using on-chain FX vs traditional markets. Wider spread = thinner liquidity. As TVL grows, spreads compress toward zero. Not financial advice.
Spot vs. On-Chain Rate — Live
⏳ Loading rates...
Spot: frankfurter.app · On-chain pool: DeFiLlama · KRW/IDR rates: reference only
Non-USD Token Coverage
⏳ Loading...
Protocol Market Share — TVL
⏳ Loading...
Top Non-USD Pools by TVL
⏳ Loading...
On-chain FX represents a fraction of the $7.5T traditional daily forex market (BIS 2022). Wide spreads reflect thin on-chain liquidity. Protocol TVL and pool data: DeFiLlama API. Spot rates: frankfurter.app. Stablecoin prices: CoinGecko via DeFiLlama. frxUSD is a USD-pegged stablecoin (Frax Protocol) — not an FX token. KRWQ listed on EDX Markets April 2026 — first institutional non-USD stablecoin on spot + perps. Educational only — not financial advice.
Whether you just heard about tokenized T-Bills for the first time, or you've been through two cycles and are building a more serious mental model — this platform is built on one idea: the quality of your questions determines the quality of your outcomes.

Below is what we're tracking, why it matters, and how to use it.
A Note On The Data
Most people sizing the on-chain private credit market look at DeFiLlama and see roughly $3–4 billion. That number is incomplete. It misses Figure — a traditional mortgage lender running $15.8 billion in home equity loans on the Provenance blockchain. It misses Tradable, Intain, and others that don't report to DeFiLlama.

The real market is $23 billion. And 67% of it is a company most DeFi natives have never heard of.

This site pulls from DeFiLlama, RWA.xyz, CoinGecko, and Yahoo Finance to give you the fuller picture. The gap between what crypto-native data sources show and what's actually happening is itself one of the most important things to understand about where this market is going.
Who This Is For
You've been in crypto long enough to have real money at stake — not just experimenting. You've lived through at least one full cycle, probably two. You know what a wallet is, what a protocol is, what yield means in practice. You've chased some of it and maybe got hurt, or watched others get hurt, and that experience changed the way you think.

You're not a TradFi professional. You don't have a Bloomberg terminal. You didn't go to Wharton. But you're also not a degen anymore — or at least you don't want to be. The "wen Lambo" phase is behind you, or you're consciously trying to move past it, because you've realized that approach doesn't compound wealth, it gambles it.

What you're building is a more serious mental model. You want to understand what you own. You want to size positions correctly. You want to know when the thesis has broken before you find out the hard way.

You're also paying attention to what's happening with institutional money coming into crypto — you sense it's significant but don't fully understand the mechanics. When you hear that Figure has $15.8 billion in home equity loans on a blockchain you've never heard of, you're genuinely surprised and want to know more. That surprise is the signal — you were missing something real, and now you know it.

You're not looking for someone to tell you what to buy. You're looking for a better way to think about it — because you've learned the hard way that the quality of your questions determines the quality of your outcomes.

That's exactly who this site is for. And that's a large, underserved audience.
What We're Watching
Traditional finance has a capital stack — a hierarchy of assets ordered by risk and return. T-Bills at the bottom. Then bonds. Then high-yield. Then private credit. Then equity. Each step up offers more return in exchange for more risk, less liquidity, or both.

That stack is being rebuilt on-chain, right now, in real time. Tokenized T-Bills. On-chain private credit. Tokenized real estate. Bitcoin treasury products that blur the line between fixed income and leveraged crypto exposure.

rwa-intel.io maps where things currently sit on that stack.
What We Don't Do
We don't tell you what to buy. We don't rate protocols. We don't make recommendations.

What we do is give you the framework that TradFi professionals apply when they evaluate yield — and translate it into the on-chain world where the rules are still being written.

Spread vs the risk-free rate. Concentration risk. Liquidity and lockup. Default history. BTC correlation. Market structure. These are the questions a credit analyst asks. We ask them here, about on-chain products, every few hours.
The Honest Version
Most people evaluate on-chain yield with one of two toolboxes. The first is pure crypto instinct — high number good, protocol has a Discord, seems legit. This is how people got wrecked in 2022.

The second is pure TradFi instinct — if it's not rated by Moody's and held in a custodied account, it doesn't exist. This misses the fact that genuinely interesting things are being built.

Neither toolbox is sufficient alone. This site is for the person building a third one.
What We Hope You Take Away
Not a trade. Not a recommendation. A better set of questions.

Is this yield real, or is it just compensating for risk I haven't priced yet? What's the spread over the risk-free rate, and is it enough? Am I being paid for illiquidity, concentration risk, or default risk — or all three? Does this product actually do what it says, or is it TradFi terminology wrapped around a crypto-native bet?

If you leave this site asking those questions about yield — any yield, on-chain or off — then it's done its job.
⏱ Next refresh: --:--
Signal Detail
—
—